Botanical Training
An evaluation of tour guide training
Time
January 2020 - May 2020
Client
Phipps Conservatory and Botanical Gardens
Role
I acted as our team’s research lead on the evaluation under the supervision of an experienced applied researcher. I met with stakeholders, developed the surveys, received edits from our supervisor, and prepared the system for collecting the data over years of training.
Summary
People who join Phipp’s learning program to become tour guides are excited to learn more about plants and how to teach others. The program aims to teach about plants, but also to be enjoyable and create happy, confident tour guides. In this evaluation, we developed a series of surveys to be delivered over multiple cohorts of tour guides to examine whether these program goals were being met and how to make improvements.
THE PROBLEM
Though the tour guide training program at the botanical gardens existed for years, the program had no method to indicate whether the training offered was effective and enjoyable. In addition, stakeholders wanted to understand why they saw attrition of some tour guides after training.
THE PROCESS
Online and In-Person Surveys
I developed a series of 3 surveys (pre, mid, post) to evaluate user learning, contentment, and perceptions of the program design. We also included variables that might explain why some learners might be more likely to stay on as tour guides and others leave. Scripts were created to ensure similar delivery across cohorts. The first of the surveys were delivered in person before the 2020 coronavirus pandemic. To accommodate online teaching, they were then developed for online data collection via Qualtrics.
Extraversion
We were interested in if some people were more successful in the program if they were more extroverted since it involves speaking with strangers who visit the Gardens. We included classic measures of extraversion in the pre-survey to explore this possibility.
Knowledge
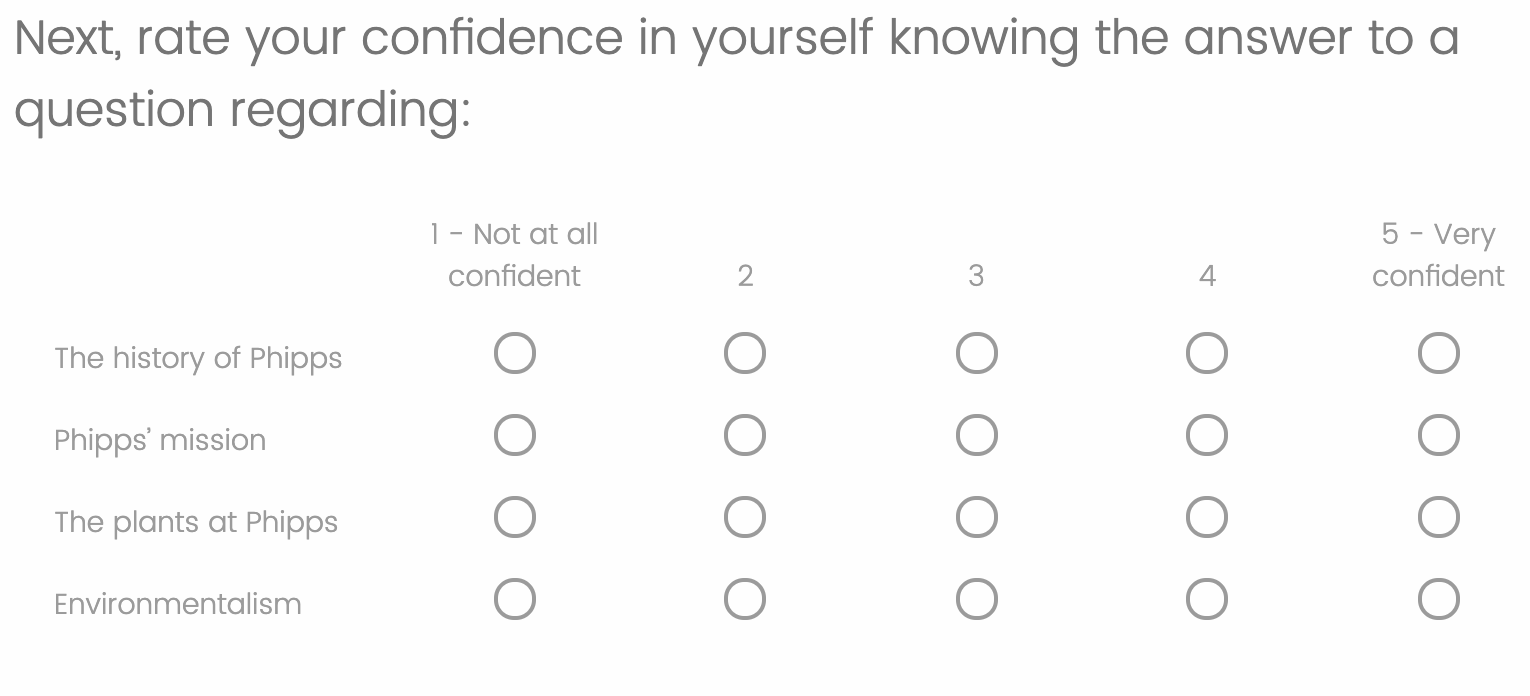
We assessed learners’ confidence in core training topics. The main goal of the training is to increase confidence in these areas.
Preparedness
In the pre-survey, we asked how prepared learners would feel giving a tour when the topic was something they were knowledgable about. In the post-survey, we changed the question to be about giving a tour about the information learned in the program. We were curious if learners’ feelings of preparedness in the post-survey would be equivalent to (or increased!) the pre-survey.
Feelings of Identity with Nature
We were curious if people might feel more connected with nature as a result of participating in the training program. We thought people who do increase in their feelings of connection might be more likely to stick with the program after training.
Role Clarity
This measures the degree to which volunteers feel they have clear expectations of their behaviors. More ambiguity in expectations can be decrease satisfaction and retention.
Barriers
We included an open-ended question at the end of the survey to directly ask learners if there were any pain points to volunteering that they wanted to share.
Satisfaction with Program
In our mid- and post-surveys, we asked questions about learners’ satisfaction with the design of the training program.
Program Duration
Finally, in the post-survey, we asked learners how they felt about the amount of time spent in the training program.
Looking Ahead
Data will continue to be collected longitudinally across cohorts and evaluated to find trends. Spreadsheets were created such that stakeholders who did not have an extensive background in data analysis could simply paste in new data and track changes over years.


